project
Ecommerce A/B Testing & Retail Funnel Analysis
A simulated A/B testing workflow on BigQuery's public ecommerce dataset, comparing product-to-purchase conversion across traffic sources and browsers, plus a category-level revenue and AOV analysis to identify the strongest product categories.
BigQuerySQLPythonpandasstatsmodelsmatplotlib
approach
- Queried event-level ecommerce data from BigQuery and built funnel tables for product view, cart, and purchase events.
- Applied a two-proportion z-test to compare Email vs. YouTube product-to-purchase conversion.
- Compared conversion rates by traffic source and browser to test whether either was a meaningful segmentation variable.
- Joined order item and product tables to analyze category-level revenue and average order value (AOV).
key findings
- Traffic-source conversion was highly consistent (26.39%–26.69%) — the Email vs. YouTube lift (1.15%) was not statistically significant at the 95% confidence level.
- Browser type was similarly not a meaningful segmentation variable — conversion stayed within a tight 26.5%–26.8% band across browsers.
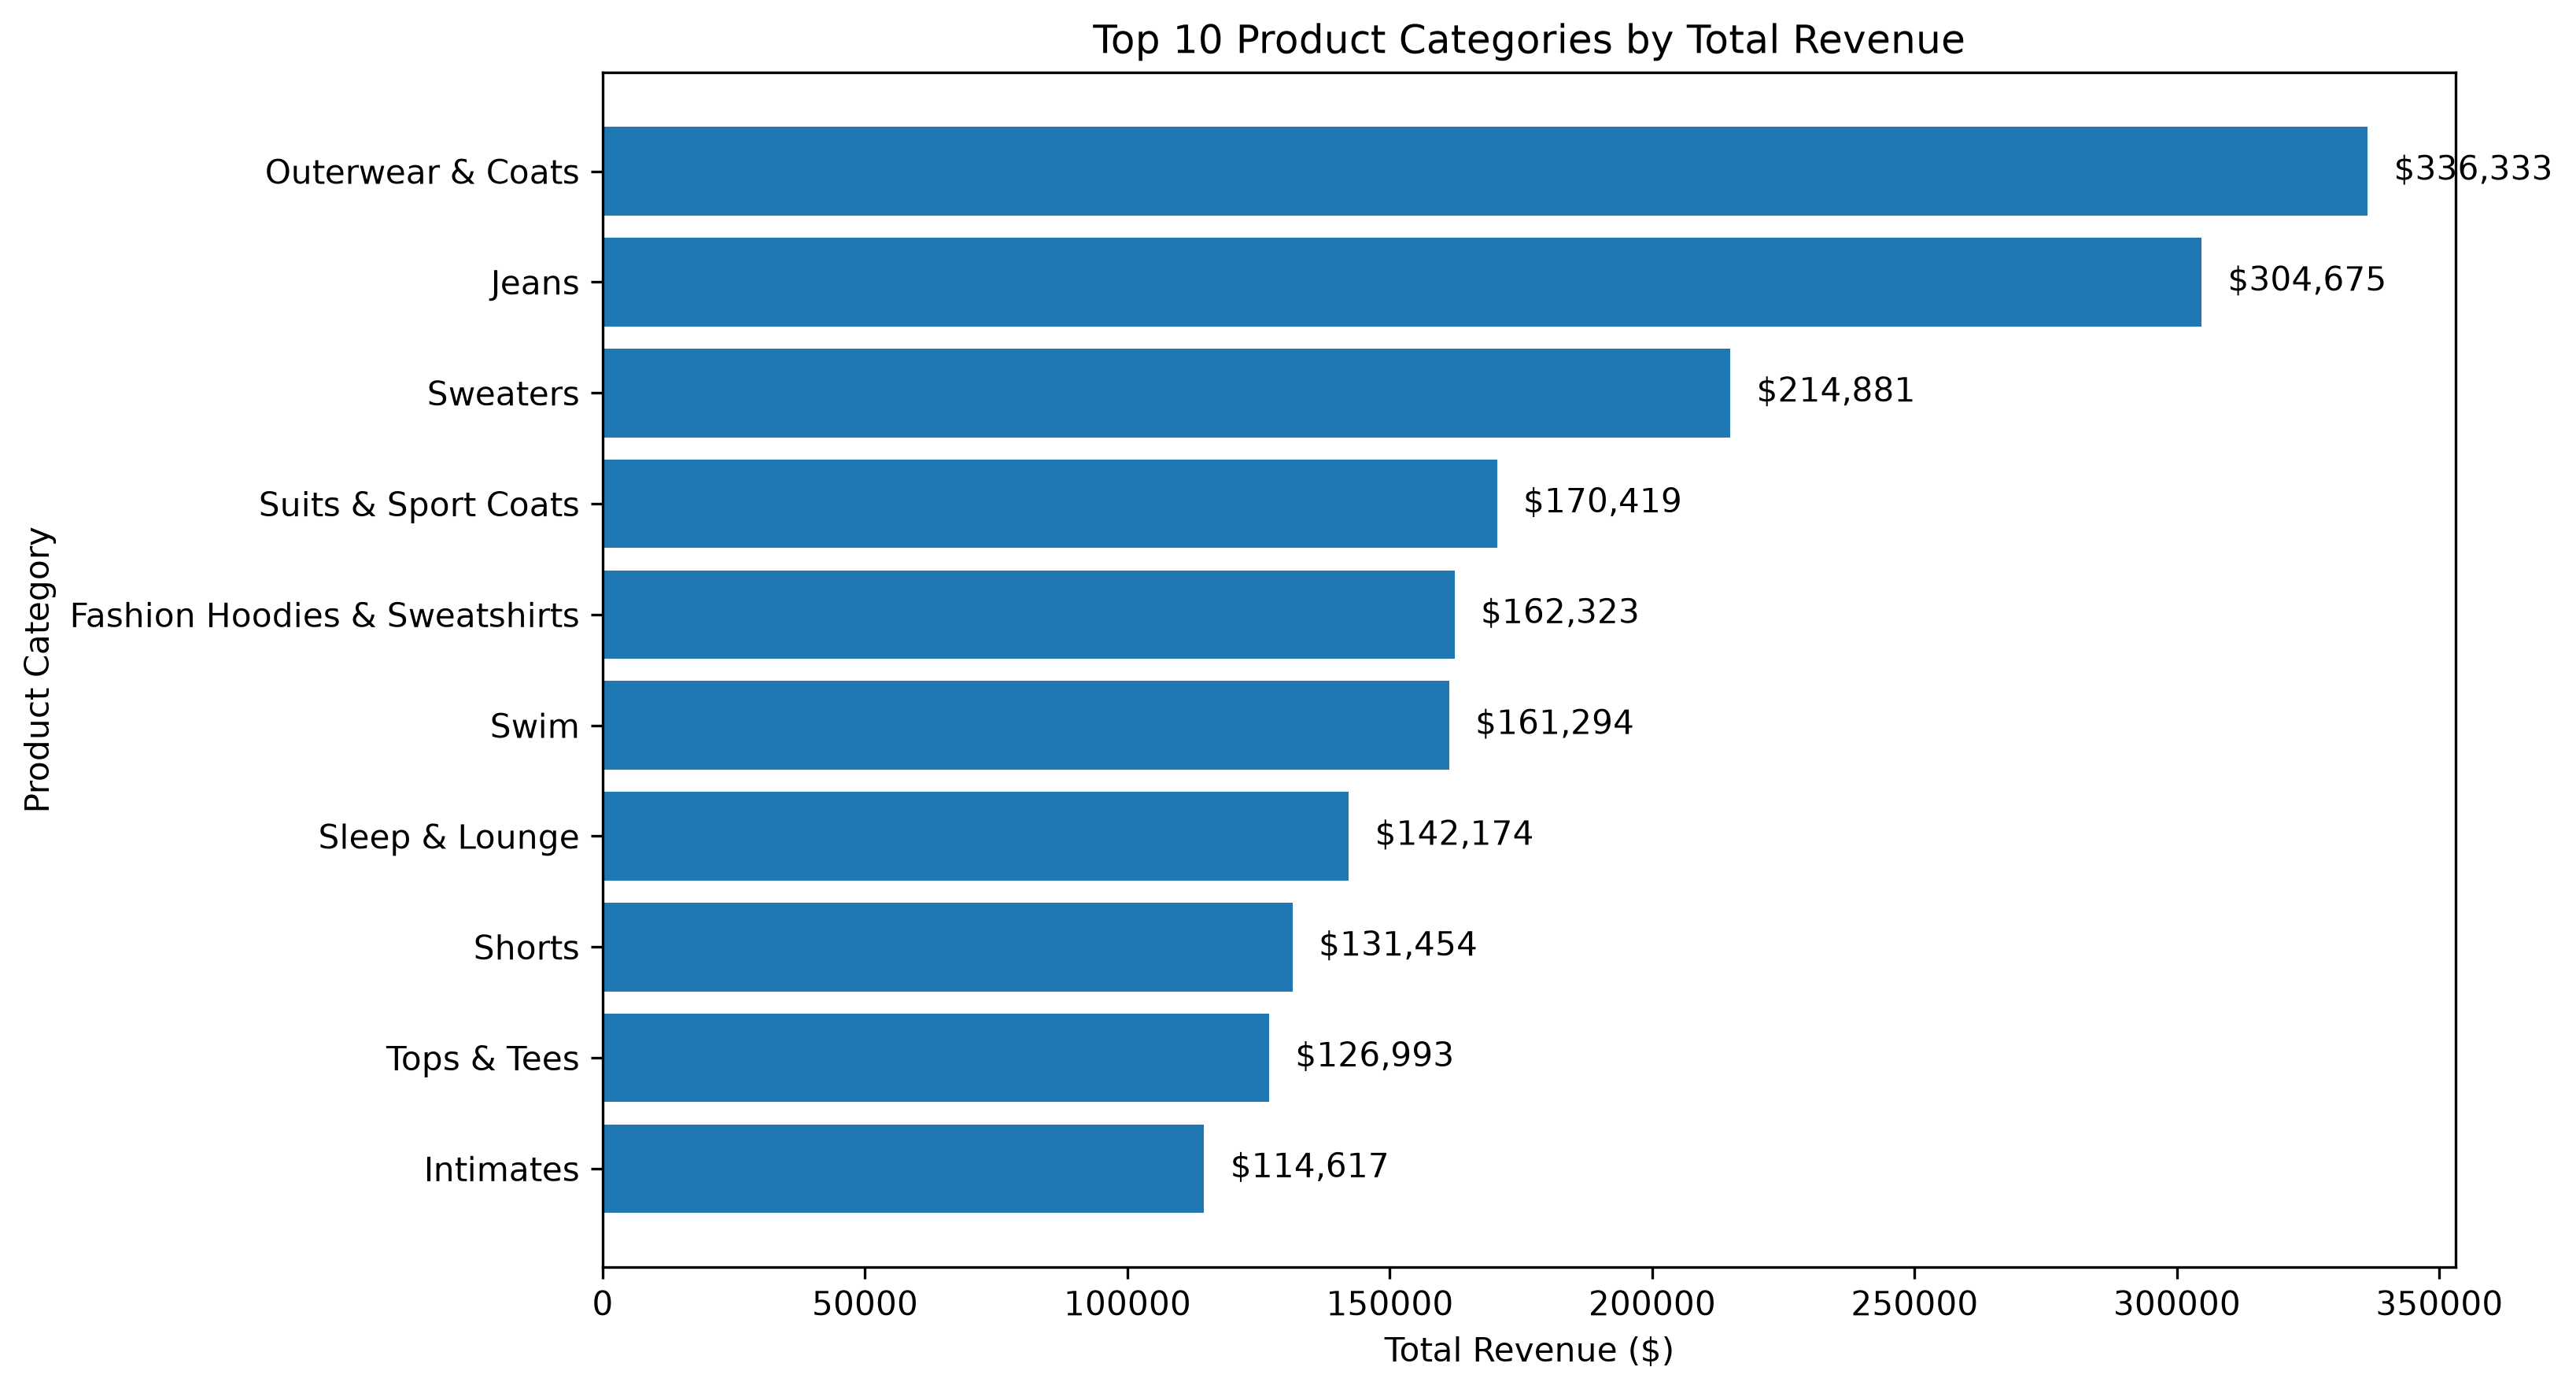
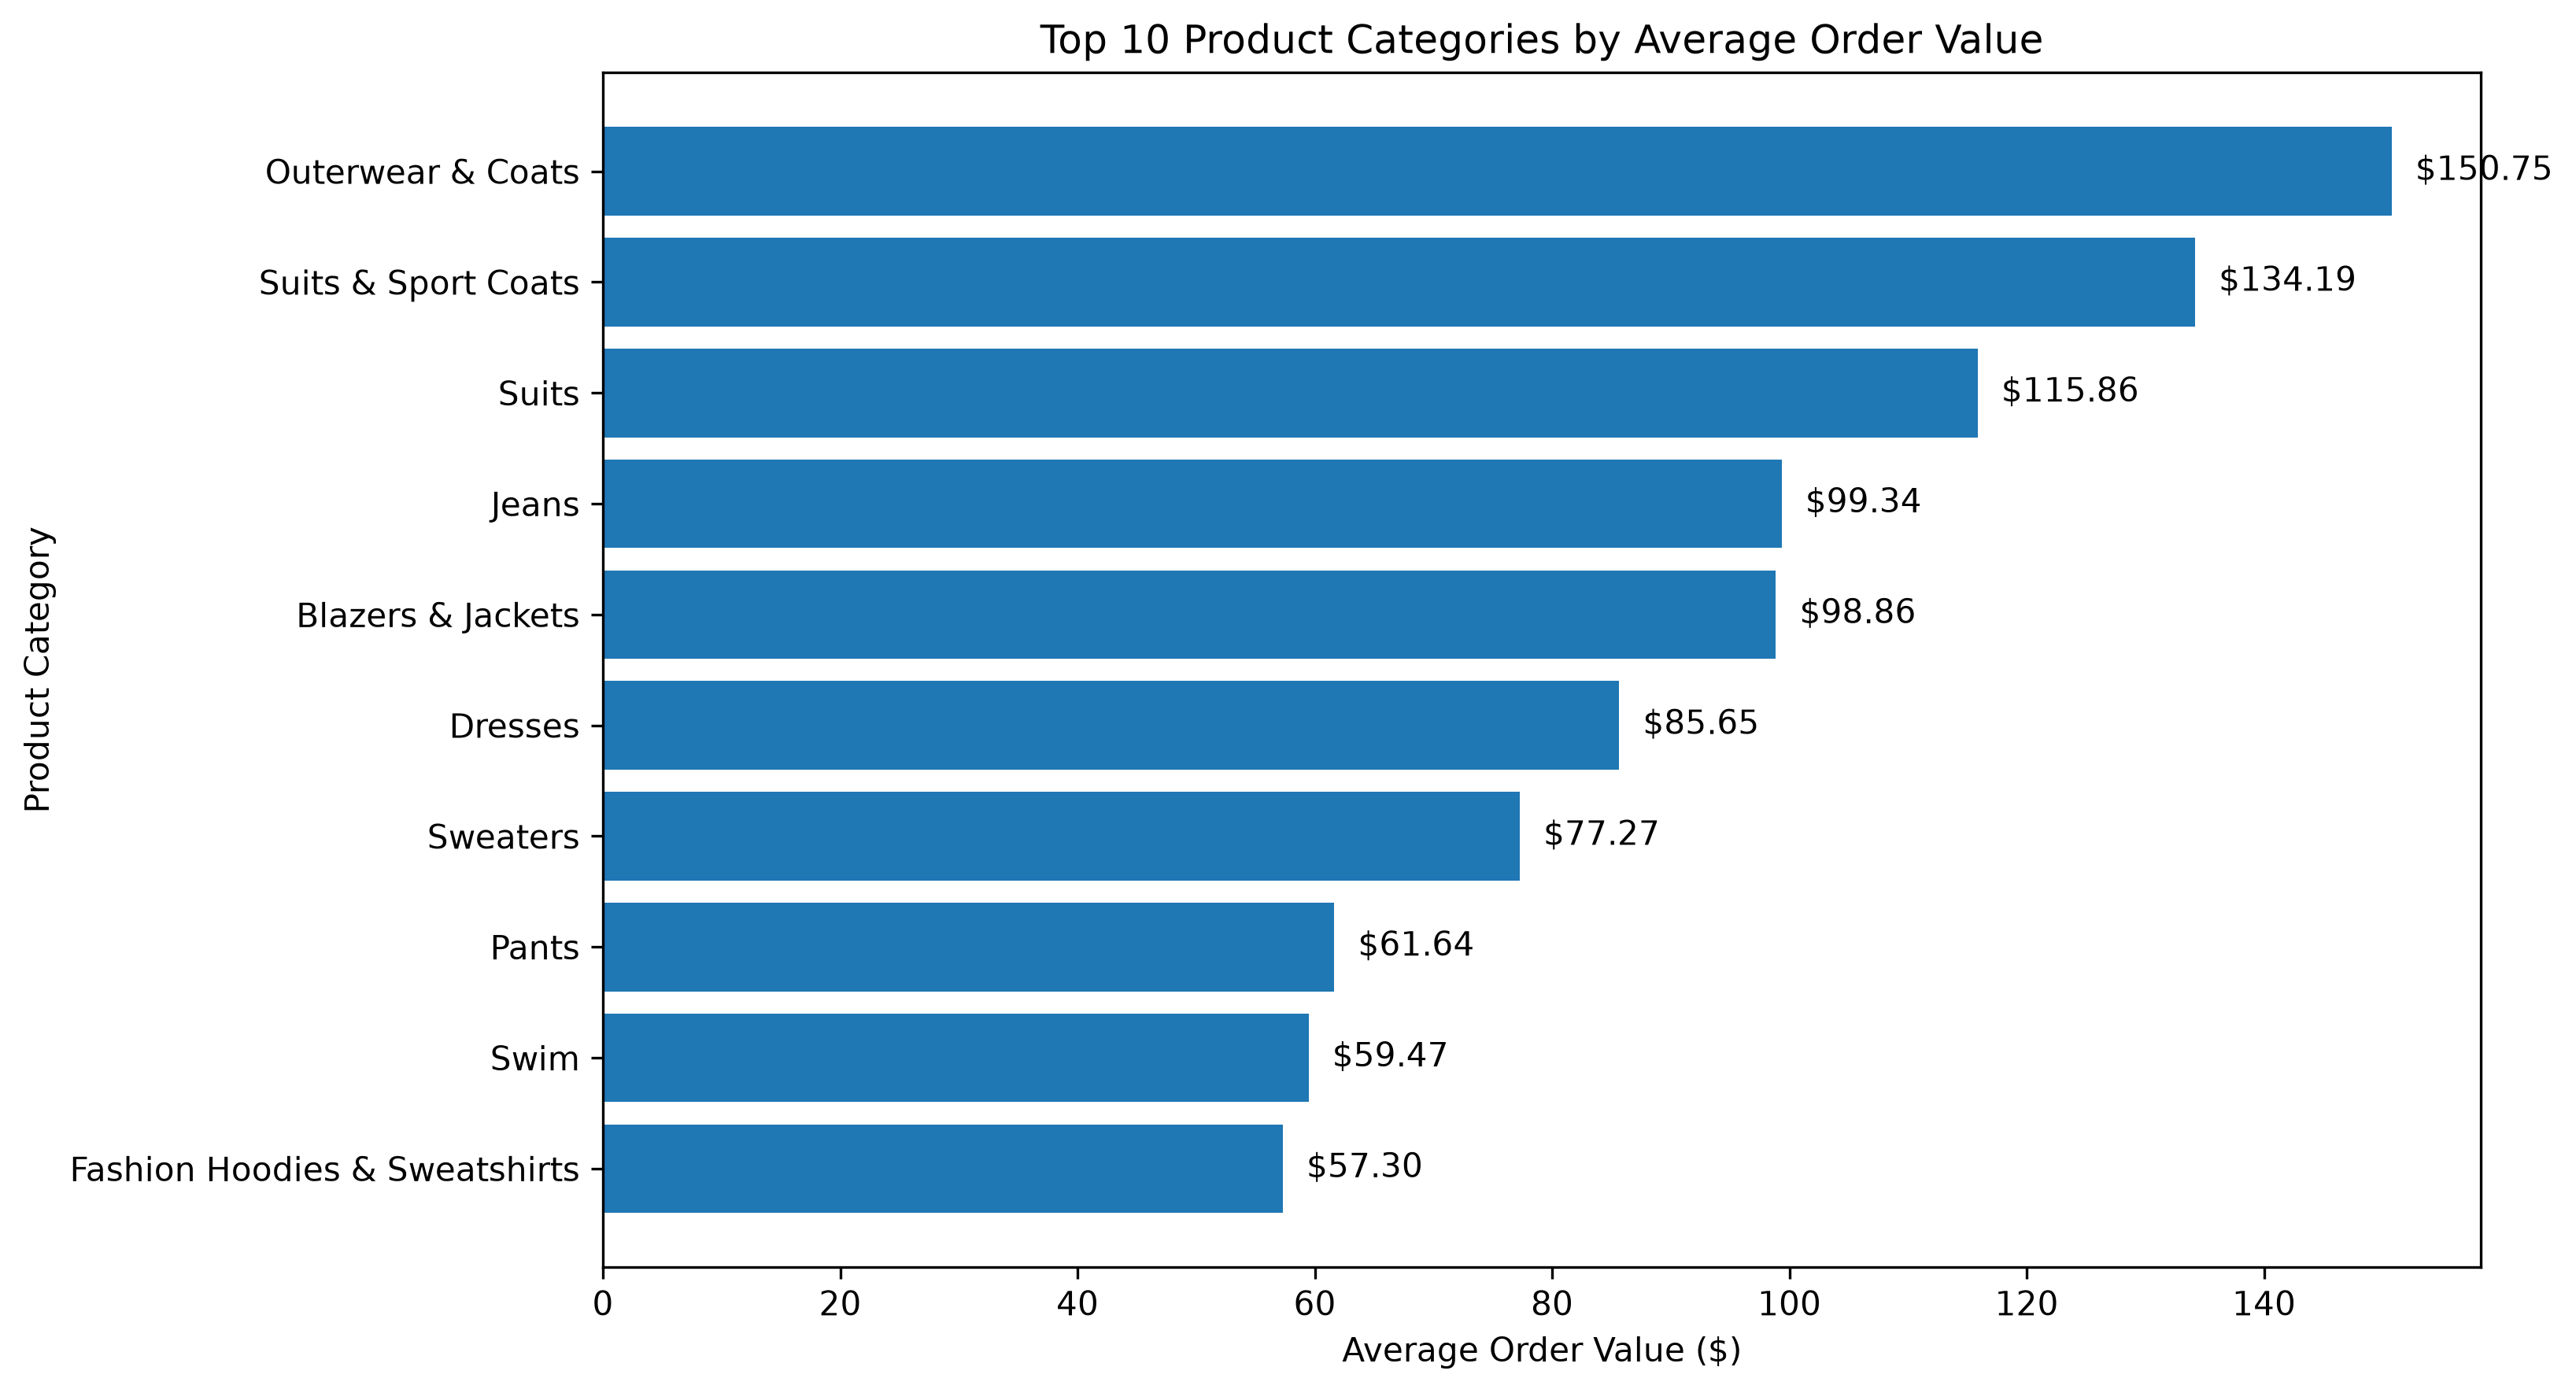
- Outerwear & Coats was the strongest category by both total revenue (~$336K) and AOV (~$151).
- Jeans had lower AOV than premium categories like Suits & Sport Coats, but higher order volume made it the second-highest revenue category — value and volume tell different stories.
results
business recommendations
- Prioritize high-AOV categories such as Outerwear & Coats and Suits & Sport Coats in paid acquisition and promotional campaigns.
- Use high-volume categories such as Jeans to support broad merchandising and retention campaigns.
- Use lower-AOV categories as add-ons or bundle products to increase cart size.
view code on GitHub →
Full SQL queries, scripts, and analysis are on GitHub.